
ATR Indicator: Measure Volatility
The market volatility is one of the key factors that determine the success of your trades. In times of high volatility, the risk of loss rises significantly. If you are a newbie, you should avoid periods of significant volatility because it becomes complicated to predict the market direction. Moreover, there are many issues with Stop Loss orders and Take Profit levels.
That’s why you need an instrument that will help you to place a good trade. There are many indicators that predict the market direction. Still, there are a few that can define the strength of market fluctuations. Average True Range is one of them.
Average True Range: What Is It?
ATR or Average True Range is an oscillator that determines the range of market volatility. It means the indicator shows the average size of the trade within a certain period of time.
ATR or Average True Range is an oscillator that determines the range of market volatility.
ATR was created by J. Welles Wilder Jr. and presented in his book "New Concepts in Technical Trading Systems." The Average True Range indicator is relatively young. It appeared in the book just in 1978. However, it’s widely used by traders all over the world.
The author also developed such famous technical tools every trader uses in their strategies as the Relative Strength Index (RSI), Parabolic SAR, and Average Directional Index.
As with any oscillator, the indicator's window is placed below the price chart. The Average True Range is presented by only one line that moves from bottom to top and back, showing the strength of market fluctuations.
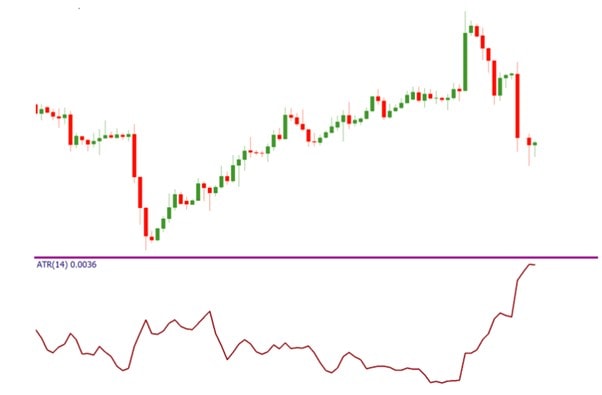
The most significant feature of the indicator any trader should know is that it doesn't show the market direction. The increase of the ATR tool signals the rise in the market fluctuations. If the ATR falls, the range of the trades decline.
How to Place ATR in MetaTrader 4
The ATR indicator is set in MetaTrader by default. It means you don't have to download it from the Internet; you can quickly apply it to the chart. For that, click "Insert" in the upper tab, then "Indicators", choose "Oscillators," and "ATR" will be in the list.
Fortunately, for beginner traders, this indicator doesn't have many settings you have to deal with. There is only a period. The default period is 14, but you can change it according to your trading strategy.
The smaller period is, the more alerts the Average True Range provides. The more significant the period is, the fewer signals it will submit.
As with any other indicator, the shortage of the period will lead to a surge in the number of signals. Nevertheless, you should be ready that the risk of fake calls will rise as well. Inversely, if the period is more significant, the number of alerts will decrease. This will help you to filter signs if you are a newbie, but you may lose some effective entry points.
Why ATR Is Effective
The Average True Range is one of a few indicators that can define market volatility. It’s crucial for investors, especially for newbies. Volatility affects such important factors as Stop Loss orders, exit points, and the size of a trade. Thus, traders either avoid trading in times of significant volatility or prepare for it.
The Average True Range is an uncommon indicator, but it’s easy and provides simple signals any trader can read.
Moreover, the Average True Range tool is easy in usage as it has only one setting. Also, the ATR provides the signals any trader can read. One line and a lack of crosses allow traders to catch signals fast.
Although there are other tools that show the power of price fluctuations, the Average True Range is a default instrument on different trading platforms. To apply it to the chart, it requires just a few clicks.
ATR: Calculating an Indicator
As with any other indicators, the Average True Range is set automatically. This means that a trader won't have to do any calculations. Still, if you want a deep understanding of how the indicator works, you should learn how to calculate it. To measure the indicator, you need to consider the most recent high and low prices and the previous period's close price.
Calculation: Steps
- Subtract the current period’s low price from the current period’s high price.
- Subtract the previous period's close price from the absolute value of the current high price.
- Subtract the last period's close rate from the absolute value of the current low price.
- To finish the calculation and define the ATR value, you need to compare three figures and choose the largest one.
Why trade with Libertex?
- Get access to a demo account free of charge
- Receive live technical assistance 5 days a week, 24 hours a day
- Enjoy leverage of up to 1:500
- Use a platform for any device: Libertex and MetaTrader 4 and 5
- Pay zero commission on withdrawals in Latin America
- Benefit from up to $500 protection on your first trades with Negative Trade Protection