

ADX: Find the Strong Trend
In a wide variety of indicators that provide different signals, it’s almost impossible to find the one that defines the strength of the trend. It’s vital to know whether the trend is stable or not, especially during the peak timeframes, when the trend exists from several days to several months. What if you see a trend and want to open a position but have no idea how soon the trend will end? Mr. Wilder invented the ADX indicator specifically for these cases.
What Is the ADX Indicator?
ADX stands for Average Directional Index. It’s a technical indicator that is mostly used to determine the strength of the trend. At the same time, it can be applied to find trends and ranges and to filter trading strategies. Usually, the indicator consists of a single line that fluctuates within the 0-100 range.
However, sometimes you can see the indicator of three lines: ADX, +ID, and –ID. Two additional lines are a positive directional indicator and a negative directional indicator. These lines serve to provide the direction of the trend. It’s unlikely you meet them separately from the ADX. Moreover, the average directional index is derived from them.
The indicator was invented by the technical trader J. Welles Wilder. He described the average directional index together with the minus directional indicator (-DI) and the plus directional indicator (+DI) in his book “New Concepts in Technical Trading Systems” in 1978.
This index has been around for many years. This proves that ADX can stand the test of time and provide valuable information. Have a look at the picture.
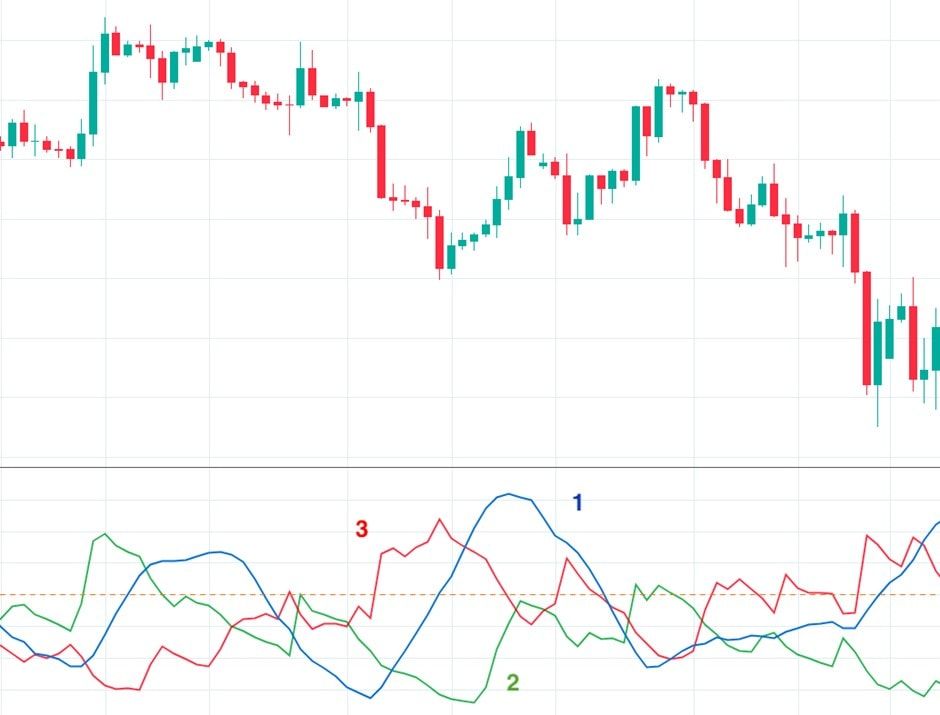
2. +ID;
3. -ID
Why ADX Is So Popular
The ADX indicator is almost the only existing indicator that shows the strength of the trend. Even though other indicators also provide signals that show close reversal or possible breakouts, the average directional movement index gives more accurate signals.
Additionally, you can use this indicator not only for trading in the Forex market, but for trading stocks, futures, and even mutual funds.
ADX Calculation
The calculation may seem a little bit complicated. Don’t worry, you don’t have to calculate the index every time you use it – it is measured automatically. The ADX formula will just help you understand how the indicator works.
The calculation starts with measuring positive and negative directional movement.
+DM = Current High - Previous High
-DM = Previous Low - Current Low
There is an exciting feature. If +DM is bigger than –DM, then –DM equals 0. If –DM is greater than +DM, +DM is 0.
As we’ve mentioned earlier, the index is derived from +DI and -DI. The positive directional indicator (+DI) amounts to 100 times the exponential moving average (EMA) of +DM divided by the ATR (average true range) over a given period of time.
14 is the standard period. The negative directional indicator (-DI) is equal to 100 times the EMA of -DM divided by the ATR.
As for the average directional index, it is equal to 100 times the EMA of the absolute value of (+DI minus -DI) divided by (+DI plus -DI).
Conclusion
The ADX indicator can be considered an exceptional indicator. It’s nearly the only indicator that provides a trader with information on the trend strength. We all remember the phrase: the trend is your friend. However, it’s not that easy to find a strong trend. As a result, you might lose money in times of breakouts and fake-outs, trend reversals, and market consolidation. To learn the indicator faster, check its signal in the Libertex demo account.
Not financial advice. The content of this article is provided by Libertex for general information and educational purposes only. It does not constitute investment advice, investment research, a personal recommendation, or an offer or solicitation to buy or sell any financial instrument or other asset. It is general in nature and is not tailored to any individual reader, so it cannot account for your personal circumstances, financial situation, knowledge, experience, or investment objectives. Any decision to act on this content is taken at your own discretion and risk, and you remain solely responsible for assessing whether a product or strategy is right for you and for seeking independent professional advice where appropriate.
Risk warning. Trading in financial instruments and other assets, particularly leveraged products such as CFDs, is complex and carries a high risk of losing money rapidly. Leverage magnifies both gains and losses, so small market movements can lead to disproportionate losses. The value of the assets referenced may rise or fall, and you may lose your entire invested amount. Past performance is not a reliable indicator of future results. The use of artificial intelligence, algorithms, automated strategies, or any other analytical tool in trading does not guarantee any particular outcome, does not eliminate risk, and does not replace your own judgement — you remain fully responsible for assessing every instrument, strategy, and decision, and for the results of your trading.
Why trade with Libertex?
- Get access to a demo account free of charge
- Receive live technical assistance 5 days a week, 24 hours a day
- Enjoy leverage of up to 1:500
- Use a platform for any device: Libertex and MetaTrader 4 and 5
- Pay zero commission on withdrawals in Latin America
- Benefit from up to $500 protection on your first trades with Negative Trade Protection