
Relative Strength Index – Your Key to Strong Signals
Traders and analysts are divided into two major groups. The first one prefers the fundamental analysis; the second one is fond of the technical indicators. However, there is a third group. They combine both fundamental and technical factors. Nevertheless, all of them should know the crucial points of each type of analysis.
In this article, we will talk about one of the most significant technical indicators – the RSI indicator.
What Does RSI Stand For?
The Relative Strength Index was created by J. Welles Wilder. Before he became a technical analyst, he worked as a mechanical engineer. This fact helped him develop not only the RSI but other indicators, such as the Average Directional Index, Average True Range, and Parabolic SAR.
As for the RSI, the RSI indicator is a price oscillator. But before we go into more detail, let us explain what the oscillator is. If you open a trading platform, for example, MetaTrader and choose the indicators tab, you will see a list of indicators that will be grouped by their functions or the name of the creator. So, you may see trend indicators, oscillators, volumes, and Bill Williams.
Oscillators are technical indicators that vary over time between two main points (key levels) and determine market conditions. Thus, they show if the market is overbought or oversold.
It’s time to get back to the RSI. We’ve mentioned the relative strength index is an oscillator that shows the strength of the price, counting the speed and magnitude of the recent price changes and depicting overbought and oversold market conditions.
If the concept is still tricky, let’s move on to examples.
How Does RSI Work and How to Read It?
As we said earlier, there are different types of indicators. They differ with functions, names, and placement. For example, take a look at the chart below. Trend indicators are applied on the chart, while oscillators are located in a window below the chart.
Same with the relative strength index. It’s placed in a window below the price chart. As you can see, there is a line, the index, and two levels – 30 and 70. The indicator shows whether the market sentiment.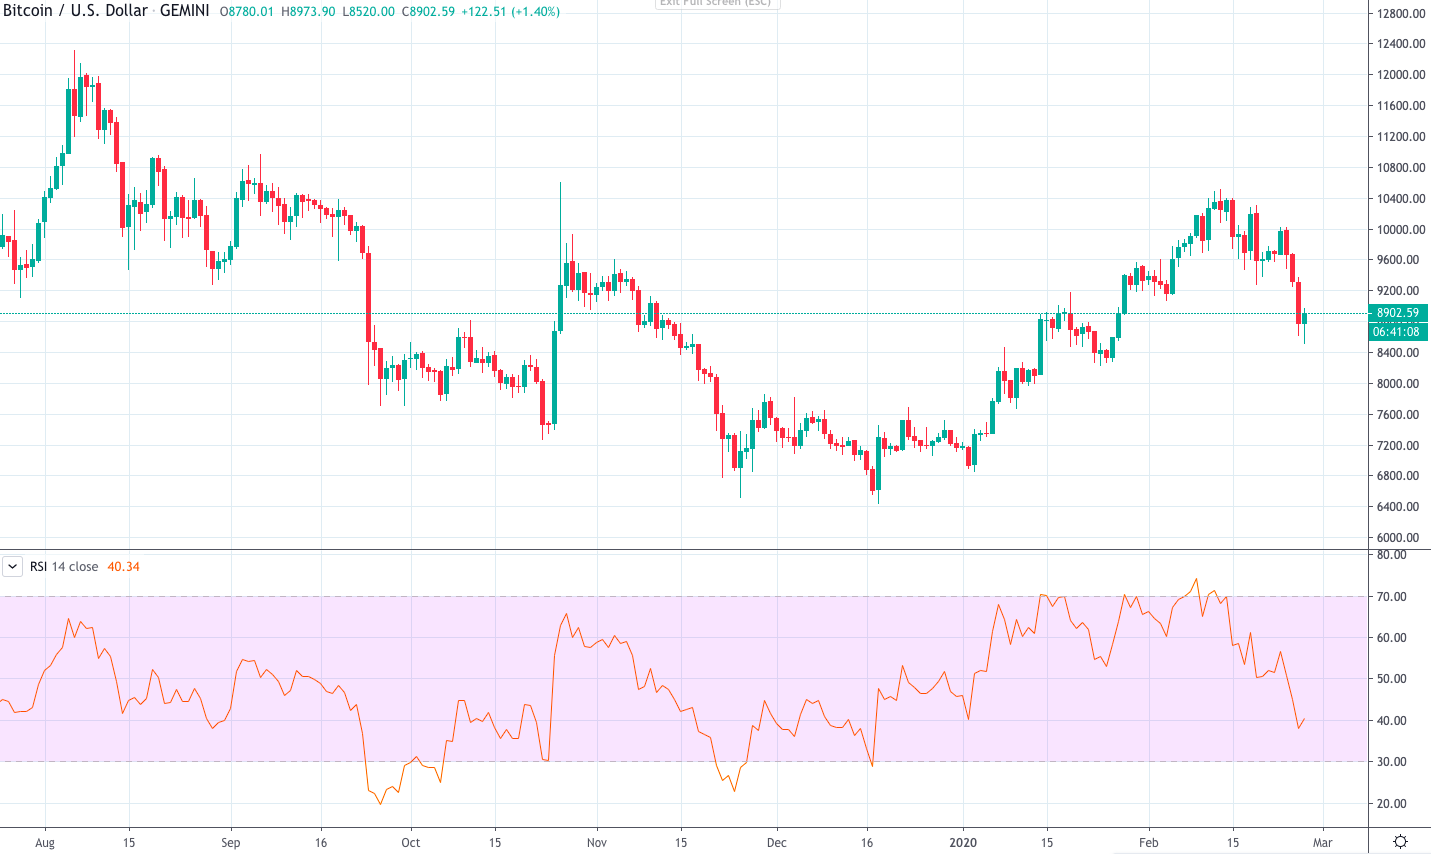
RSI Indicator: Buy and Sell Signals
The first and primary RSI function is to determine the market condition. You’ll need to look at the indicator. The 30 level is a border of the oversold area. A break below this level signals sellers (or “bears”) prevail in the market. This situation means the asset is oversold, and traders can expect a market reversal.
Remember one crucial aspect of trading: rise or fall of the asset can’t last forever, a reversal will take place soon. However, the indicator will give you a signal only if it crosses the 30-level bottom-up. It will mean the reversal is taking place. Nevertheless, don’t blindly believe one indicator. Get a confirmation from a candlestick or another indicator, for example, MACD. As soon as you get more proof, you can go long.
The second crucial level of the indicator is the 70 level. It’s a vital point in the overbought area. If the indicator enters the area above the 70 level, it means there are too many buyers (or “bulls”) in the market, and the asset is overbought. Thus, traders can expect a reversal down. Again, the signal appears only if the index crosses the 70 line from top to bottom. Remember the confirmation. If you get it, open a short or sell position.
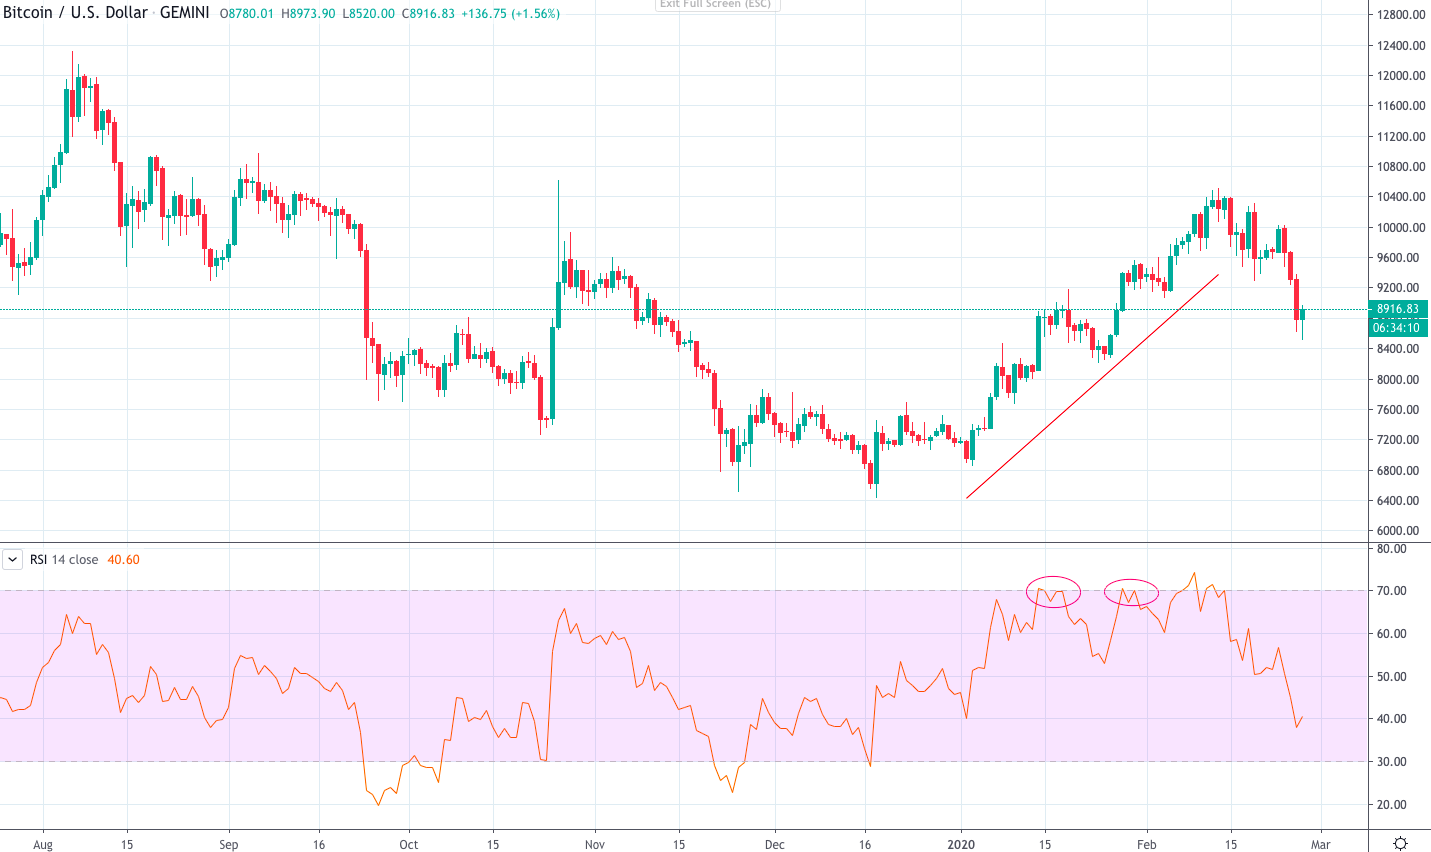
Note: although the indicator gives a signal when the market is oversold or overbought, you should look at the situation as a whole. In times of the strong trend, the indicator can stay in the oversold/overbought area for a long time. If you notice a strong downtrend, don’t wait until the RSI crosses the 30 level from bottom to top. Sell until the indicator is in the oversold areas. The same rule applies to the overbought zone. Buy within the strong uptrend. We can find a good example in the crypto market.
On the daily chart of BTC/USD, you can see that the RSI indicator was in the overbought area several times. However, the direction of the pair didn’t change due to the strong uptrend. Moreover, if the indicator doesn’t go far in overbought or oversold area, it’s more likely, that the trend will continue.
Bullish and Bearish Divergence
Divergence is the second indicator’s function. Divergence gives a stronger reversal signal than the 30/70 levels. All you need to do is find a difference between the direction of the price chart and the indicator. When a new high of a price is not followed by a new top of the relative strength index, it’s called a bearish divergence, you got a signal to sell. That means the price will move down soon. If the price forms a lower low while the index has a low that is higher than the previous one, it’s a bullish divergence or a signal to buy.
Bitcoin RSI Chart
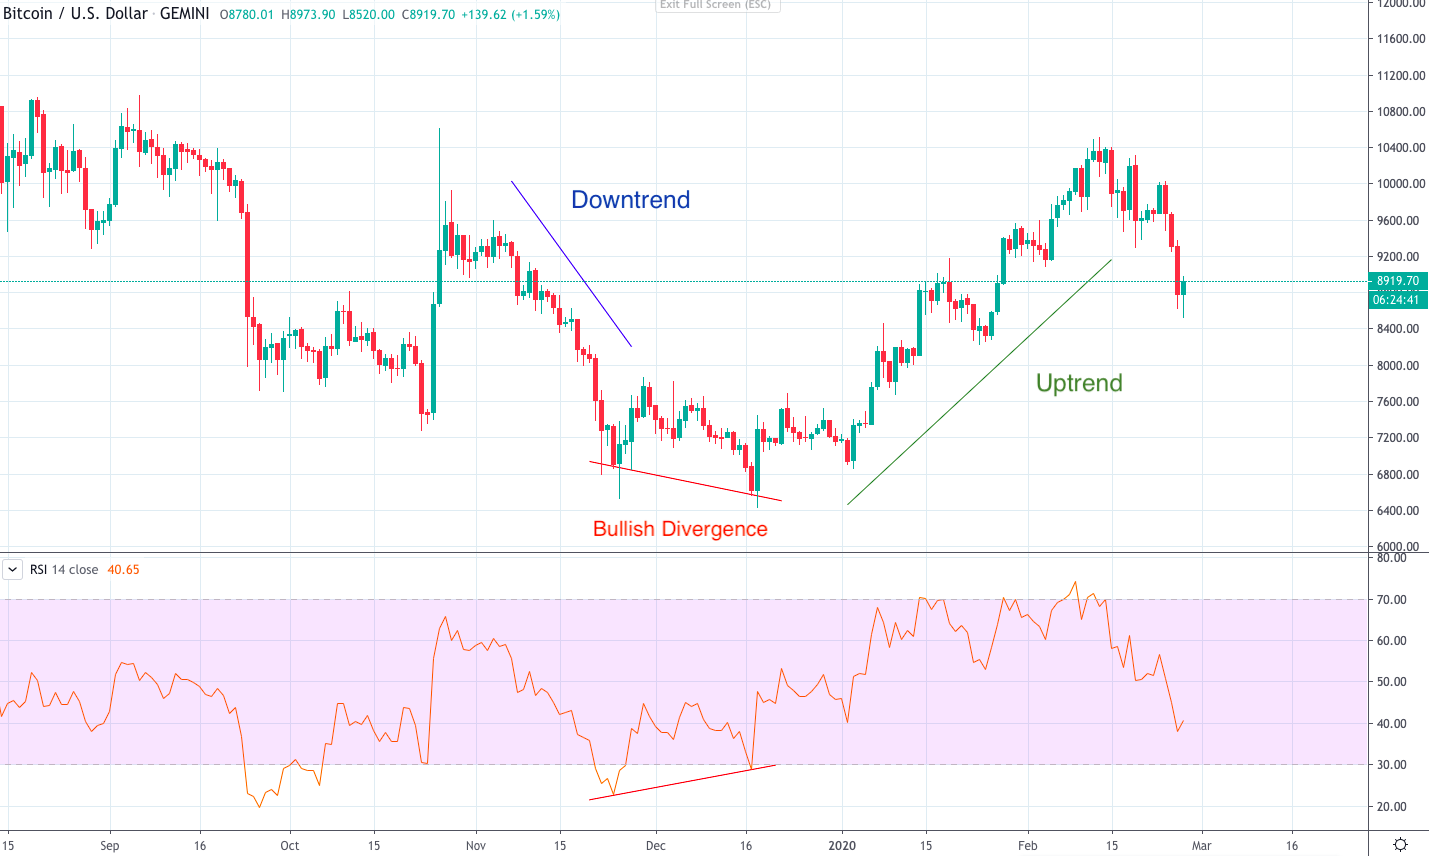
On the daily chart of the BTC/USD, we noticed a bullish divergence when the price formed a lower low, while the low of the RSI was higher. It was a signal of the trend reversal. Before the divergence, the price had been going down, forming a downtrend. After the divergence, we see a consolidation that was followed by the change of the trend.
Why trade with Libertex?
- Get access to a demo account free of charge
- Receive live technical assistance 5 days a week, 24 hours a day
- Enjoy leverage of up to 1:500
- Use a platform for any device: Libertex and MetaTrader 4 and 5
- Pay zero commission on withdrawals in Latin America
- Benefit from up to $500 protection on your first trades with Negative Trade Protection