A Pullback: Trade Against a Trend
Reading analytical outlooks on the price movements, you might be met with the word “pullback”. Many trading strategies are based on a pullback action. Pullbacks allow you to trade against the trend.
Do you think that it’s wrong as the theory teaches you to follow the primary trend? What is a pullback actually? Keep reading to learn about tricky pullbacks.
Pullback: Definition
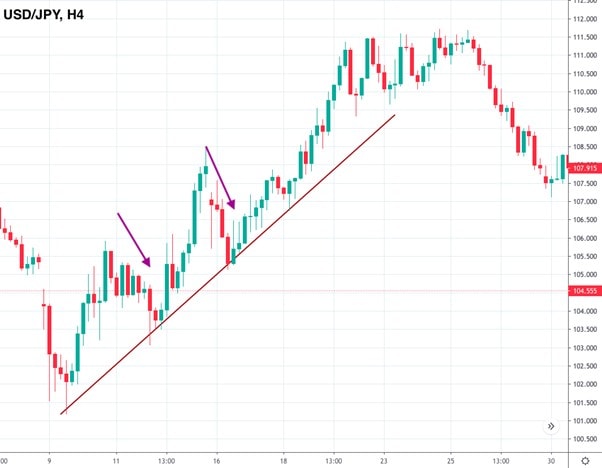
If you are familiar with a price chart, you know that an asset never goes straight. It moves up and down even within trends. Look at the image below. We have a strong uptrend. Every time the price goes down, it’s a pullback.

A pullback is a short-term price movement against the primary trend.
You should already be able to catch the pullback meaning from the explanation above. Simply stated, a pullback is a movement against the primary trend for a short period of time.
Triggers of Pullbacks
We can say that a pullback is a pause of the primary trend. It means that bulls in a downtrend and bears in an uptrend take control over the price for a while. There can be several reasons why the price changes its direction. To predict a pullback, you should learn about fundamental analysis.
Pullbacks occur due to a change in market sentiment.
- Speaking of Forex, there can be news that signals a weakness of the base currency. Economic events mentioned in a calendar also affect the strength of currencies.
- If you trade metals, you should pay attention to the news. The overall market sentiment has an impact on their price.
- Choosing oil, you should follow the news that defines the market sentiment as oil is a risky asset. Also, crude oil inventories data influences the commodity’s value.
- If you are experienced enough, you can try pullback stock trading. Earnings reports, internal company’s events and industry news affect the price movement.
Pullbacks: Real Examples
To predict pullbacks, you should know how to analyze price movements. Let’s consider a real example of a pullback.
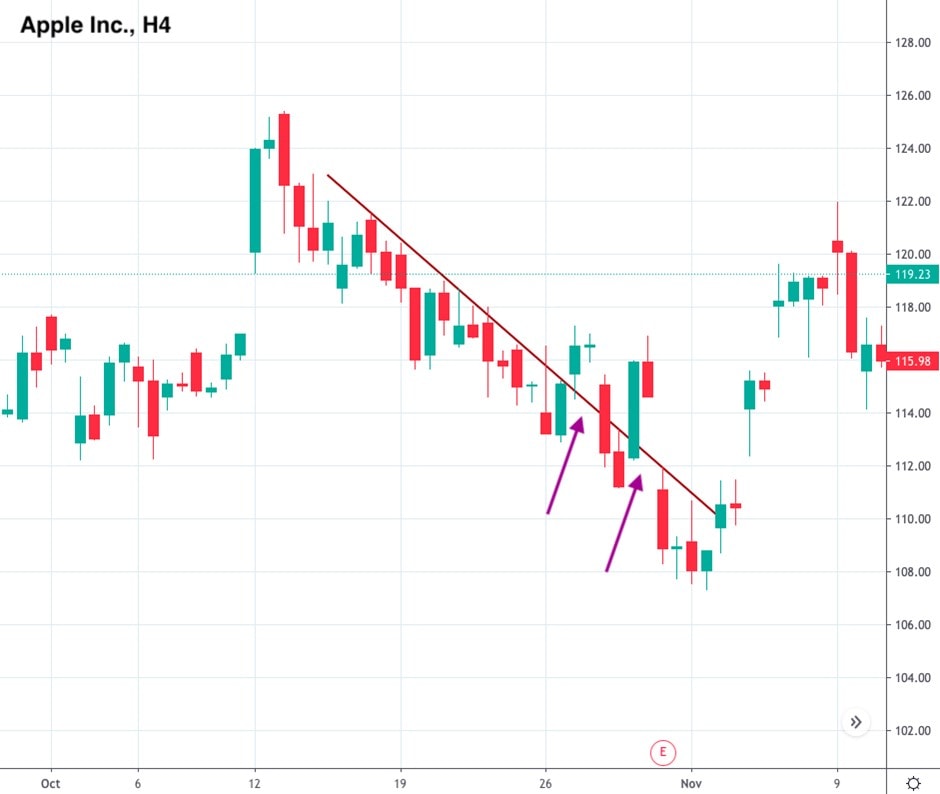
Pullbacks occur not only on currency charts, but on the chart of any financial asset. Consider an example of a pullback stock trading. It’s a four-hour chart of Apple stocks. As you can see a pullback may also happen in the downtrend. Moreover, during a pullback candlesticks can break above resistance or below support, but later return.

Pullbacks: Benefits and Drawbacks
A pullback is a complicated pattern that has more disadvantages, especially for a beginner trader.
Benefits | Drawbacks |
Better conditions. A pullback allows traders to buy at a lower price in an uptrend and sell at a higher price during a downtrend. Imagine you couldn’t catch the beginning of the uptrend but still would like to enter the market. The price moves up in the upward trend; thus, every time the peak is formed, your chances to buy at an appropriate price reduces. However, when a pullback happens, you get an opportunity to get a lower price. | Pullback or reversal? It’s not easy to determine whether it’s a pullback or a reversal, especially for newbies in the Forex market. Imagine you thought the market turned down for a short-term and kept your trade open expecting the trend will continue. However, it was a trend reversal, and you suffered significant losses. |
Difficult to predict. It’s hard to predict the beginning of the pullback and its end. You can easily miss the point when the trend resumes. |
Why to trade with Libertex?
- access to a demo account free of charge
- technical assistance to the operator 5 days a week, 24 hours a day
- leverage up to 1:500
- operate on a platform for any device: Libertex and Metatrader 4 and 5
- no commissions for extractions in Latin America


