
Fibonacci Tools for FX Trading
Every trader should have a wide range of instruments to predict market movements. And of course, every trader should know about the Fibonacci indicator instrument. This indicator provides many signals that will help you place profitable trades. However, it’s tricky to put it on the chart so read on to reveal its benefits.
What is Fibonacci?
Fibonacci is a commonly used trading indicator used in technical analysis that provides levels of support and resistance. At the same time, these levels can be used as perfect entry and exit points if you know how to use its signals.
Fibonacci Sequence
In the 13th century, Leonardo Fibonacci discovered a sequence of Fibonacci numbers: 0, 1, 1, 2, 3, 5, 8, 13, 21, 34, 55, 89, 144, etc. If you look carefully, you will notice that every following number is the sum of the two previous ones. What is more interesting is that their ratios stand for the proportions in the universe. For example, a tree branch has a Fibonacci spiral.
How to Calculate Fibonacci
The Fibonacci retracement levels are counted on these numbers. Each previous number amounts to approximately 61.8% of the following number, 38.2% of the number after, and 23.6% of the figure after that.
The crucial Fibonacci retracement levels are 161.8%, 61.8%, and 38.2%.
There is also another figure that is presented as a ratio between any number of the row and the previous one. It amounts to 161.8%. However, there is also a 50% line that takes part in many signals.
How Fibonacci Levels Look Like
Fibonacci tools look like horizontal lines with specific numbers and one baseline that connects two points of the current trend.
Where to Find
As Fibonacci tools are highly popular among traders, they can be found on different trading platforms. If you use a MetaTrader, find the “Fibonacci” window in the “Insert” tab. There will be a list of tools you can choose from.
One of the advantages of the Fibonacci tools is that they are available for free and don’t require additional downloads.
Fibonacci retracements and expansions are the most famous of the Fibo tools.
The Fibonacci tools contain Fibonacci retracement levels, Fibonacci expansions, fan, arcs, and time zones. We will talk about the Fibonacci retracements and expansions as they are used the most.
How to Use Fibonacci Retracement in Forex
Fibonacci retracement levels are used to predict the price correction against the primary trend.
How to Place
It’s essential to apply the indicator correctly to catch working trading signals.
- Find the Fibonacci retracement on your trading platform.
- Determine the current trend and find the highest and the lowest points. There must be no other tops and bottoms that exceed those you have chosen.
- Draw a line, so-called baseline, connecting the highest and the lowest points.
- If you trade in the bullish trend, draw the line from bottom to top. If you consider a bearish trend, the line should go from maximum to minimum. To make it easier, remember that you should draw the line from the left corner to the right corner.
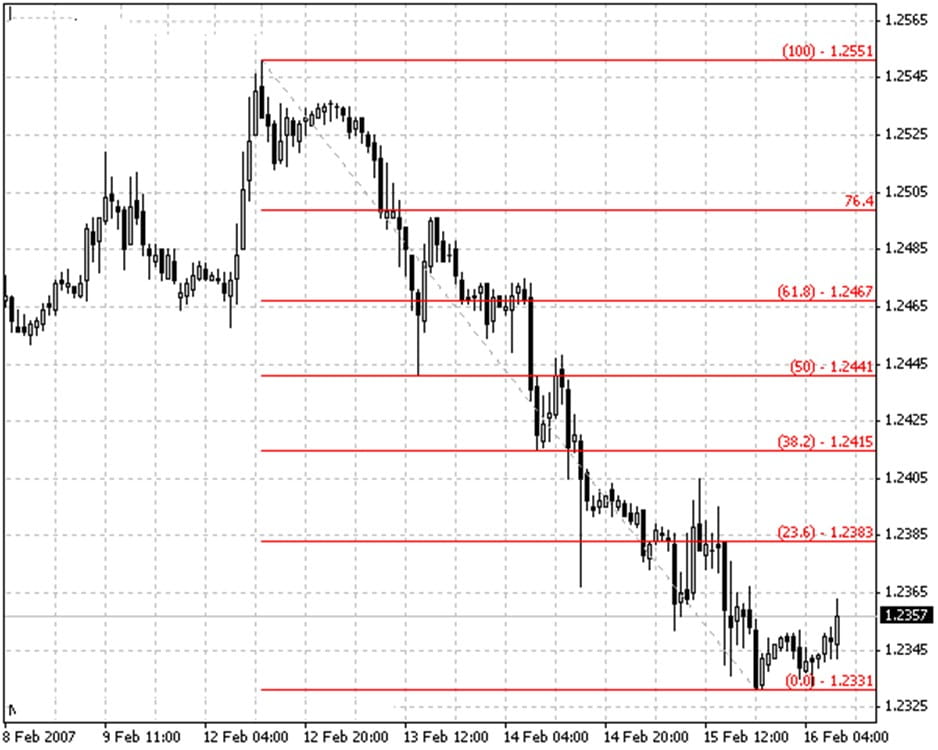
- As soon as you draw the line, six horizontal Fibonacci levels will appear. These are 0.0%, 23.6%, 38.2%, 50%, 61.8%, 100%. You can always add additional levels if your trading strategy requires it.
- As these levels are used as support and resistance points, the price is supposed to consolidate near them. In such a situation, the price should either break the Fibo level, it will mean the trend is strong or move to the next level, signaling a continuation of the correction.
Fibonacci levels are widely used in swing trading strategy. When Coming to Fibonacci retracement levels, the price starts consolidating.
Consider some signals the levels may provide.
- If the price moves more than 61.8% of the preceding movement, there is a chance it will hit the level of the beginning of the trend.
- The 50% level is one of the most crucial levels. If there is an uptrend and the price breaks above it, it’s a signal to buy. If the price moves in the downtrend, it’s a sign of the short position.
- 50%, 61.8%, and 78.6% are the essential levels where the price shows the strongest reactions.

Why trade with Libertex?
- Get access to a demo account free of charge
- Receive live technical assistance 5 days a week, 24 hours a day
- Enjoy leverage of up to 1:500
- Use a platform for any device: Libertex and MetaTrader 4 and 5
- Pay zero commission on withdrawals in Latin America
- Benefit from up to $500 protection on your first trades with Negative Trade Protection