
Japanese Candlesticks: Find Reliable Signals
There are different types of charts. Nevertheless, most traders prefer Japanese candlesticks. The candles provide the full range of information a trader needs to build a successful trade. Moreover, candlesticks combine patterns that serve as reliable signals of the market’s direction. To know more about the most trustworthy patterns and candlesticks’ signals, read on.
What Is Japanese Candle?
Japanese candlesticks are the most comprehensive chart type that shows crucial price points: open, close, high, and low. If we consider other types, such as the line chart, we will notice that it only connects dots of close prices. Thus, it provides a lack of useful information for trading.
Japanese candlesticks are the chart type that provides useful information on market dynamics.
One candle reflects the price’s dynamics within a particular period. The period depends on the timeframe you use for trading.
Japanese Candle: What It Looks Like
A candlestick looks like a bar (body) with or without thin lines (so-called shadows). The body is a range between two major points – open and close prices. Shadows are placed above (upper shadow) and below (lower shadow) the body and correspond to the highest and lowest price points.
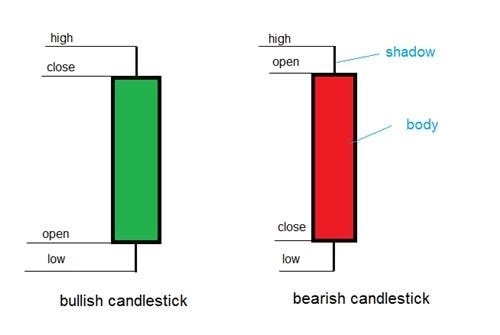
Candlesticks have two colors. Usually, traders use either black and white or green and red schemes. Thus, if the candle is white or green, it’s bullish and means the price was growing within the chosen period. If it’s black or red, it’s bearish and reflects the downward price direction within the selected period. Nevertheless, trading platforms allow you to choose the colors you like.
To learn how to read candlestick charts, let’s look at the example. You see a bullish candlestick as it has a green color. We chose a EUR/USD pair and a 1-hour timeframe, so you know how the price of an asset rose within one hour.
1.1363 is the highest point that stands for the highest price within one hour. 1.1338 is the close price, the level at which the candle closed after one hour passed. 1.1233 is the open price, the rate at which the EUR/USD trade opened. 1.1195 is the lowest point the EUR/USD pair reached within one hour.
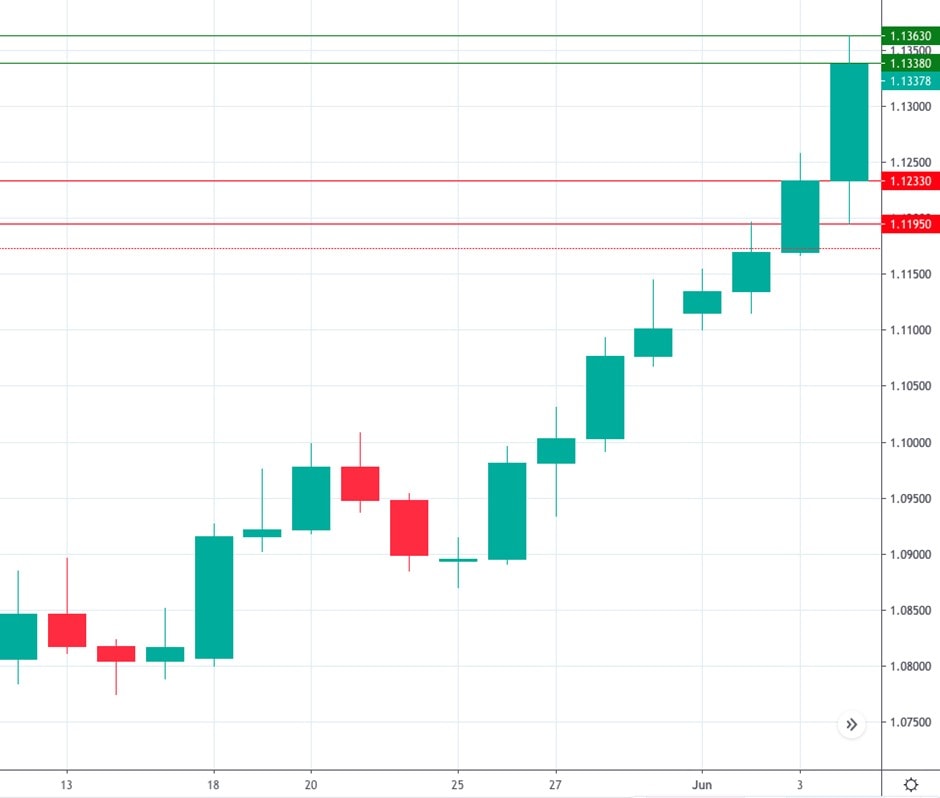
Here, we showed the bullish candle. If you see the bearish one, it will have a different color and open, and close prices will be placed opposite each other. Thus, the open price will be above the closed one.
However, the whole chart consists of many candlesticks. Consequently, you have the entire picture of the price movement.
Japanese Candlesticks and the Bar Chart
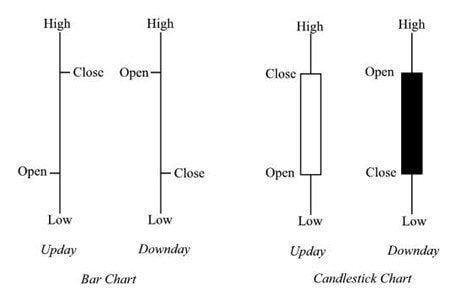
Although both types provide information on four crucial price points, Japanese candlesticks are more convenient. Earlier, bars were depicted only in the color black. Currently, traders can use the same colors as for Japanese candles. However, if you use the black and white scheme, it’s difficult to understand whether bulls or bears are dominant in the market.
Still, when looking for candlestick chart patterns, it’s complicated to determine the bar’s size. The length of the shadows is hardly defined as well. Thus, bar charts are not the best option for trading patterns.
Japanese Candlesticks: Types
There are different types of candles. As we said at the beginning of the article, candlesticks can be either with or without shadows. Moreover, they may have either one shadow or two.
Doji
A doji candlestick is a candle with a tiny body that means that opening and close prices were at nearly the same level. It usually has long shadows. Doji candlestick is always a sign of traders’ uncertainty.
Doji doesn’t provide strong signals itself and is considered a “neutral” candle. However, it can be a part of a reliable pattern. If it follows a series of bullish candles, it’s signal bulls have become exhausted, and the trend reversal may happen soon. If doji comes from several bearish candles, it’s a sign of bears’ weakness and a possible reversal up.
At the same time, doji candlestick has four types.
- Long-legged doji. It has long upper and lower shadows with almost the same length. This type reflects the great indecision of investors.
- Dragonfly doji. It’s a strong bullish reversal candlestick that appears at the end of the bearish trend. It has a long lower shadow.
- Gravestone doji. Opposite to dragonfly doji, it occurs at the end of the bullish trend. The candle has a long upper shadow.
- Four price doji. You will barely find such a candle on the chart. It shows total market uncertainty and has no shadows.

Shadows
The length of shadows represents the strength of market fluctuations. Thus, if a candle has long shadows, it means high volatility occurred during the trading session. If shadows are short, it means the market was stable.
- Long upper shadow. If the candlestick has a long upper shadow and a short lower one, it presents bulls who were more active during the session. Still, they couldn’t keep the control, and bears managed to pull the price lower.
- Long lower shadow. If the candle has a long lower shadow and the short upper one, bears dominated in the market, but bulls were stronger to the end of the session and pushed the price up.
Spinning Tops
The spinning top looks like a doji candlestick. However, the body of the spinning top is more significant. Still, this type of candle has long shadows. Spinning tops also reflect uncertainties of the market but mean both buyers and sellers were active.
Nevertheless, they couldn’t get the situation under control. Like doji candles, if the spinning top follows bullish candlesticks, it’s a sign of the possible reversal down. If the spinning top appears after bearish candles, you may expect the reversal up.
Marubozu
A Marubozu candle doesn’t have upper or lower shadows. When an open price equals the minimum one, and a close one equals the maximum amount, it’s a bullish Marubozu. Contrary, if the opening price is the same as the maximum price and a close one is similar to the minimum one, it’s a bearish Marubozu.
Why trade with Libertex?
- Get access to a demo account free of charge
- Receive live technical assistance 5 days a week, 24 hours a day
- Enjoy leverage of up to 1:500
- Use a platform for any device: Libertex and MetaTrader 4 and 5
- Pay zero commission on withdrawals in Latin America
- Benefit from up to $500 protection on your first trades with Negative Trade Protection