Technical Analysis
It would not be an exaggeration to say that technical analysis is the most popular analytical method in the financial market. Many new Forex traders follow strategies based on the results of this analysis. However, not everyone truly understands what technical analysis is, what it’s based on, or why this trading strategy is sometimes successful and sometimes not. You will learn about the different types of technical expertise, advantages, and disadvantages while reading this article. It will also help you decide whether or not you are going to use this method in your trading strategy, and if so – how to use it correctly.
Definition of Technical Analysis
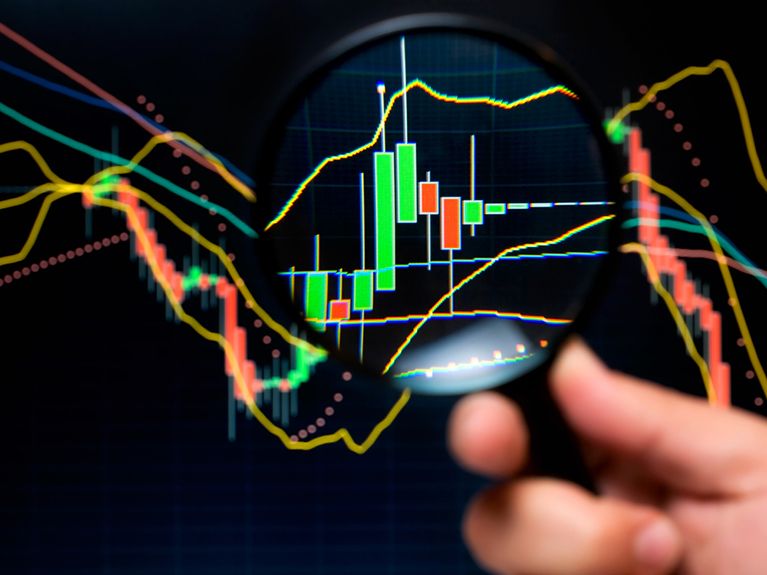
Technical analysis is a prediction of future price changes based on the analysis of price changes in the past. Technical analysis consists of the study of charts and the identification of patterns. Mathematics and statistics calculations are often used to convert models and patterns that are formed in the chart into the forecasts, which determine the one that can be opened for trading.
History of Technical Analysis
It is believed that technical analysis was first implemented in Japan during the 18th and 19th centuries. During those times, Japanese rice merchants started using charts to track and analyze product prices.
Later, Western countries called these charts “Japanese candle”.
At the end of the 19th and beginning of the 20th century, an American journalist and researcher named Charles Dow started the classic technical analysis. His published series of articles about prices on the securities market later became a fundamental component of the Dow theory.
In the middle of the 20th century, the development of computer technologies allowed the first indicators to appear. The indicators calculations were created automatically, which made it possible to apply the results of complex formulas to the graph. From that point onwards, computer analysis developed very fast, indicators began improving, and new tools were found. “Candle” and graphic analyses have kept their initial design, but they are still quite popular among traders.
Postulates of Technical Analysis

There are several main postulates of the technical analysis made by Charles Dow (or by his followers on the basis of his articles). They represent the very essence of technical expertise and explain why it should even work in the first place.
Price considers everything
This postulate rejects the significance of the fundamental analysis. Price considers everything means that there is no point in tracking down all economic and political news, pay attention to the “loud” events. Everything that could affect the price is already taken into account. That is why the priority is to study charts and indicators.
Price movement delivers the trend
Random price fluctuations form the sequences – trends. Each timeline represents the directional price movement (ascending and descending trends), or flat – fluctuations in the horizontal diapason. Even though the tendencies break and change sooner or later, it is believed that the possibility of the continuation of the current trend is higher than the probability of its change.
History repeats itself
This postulate explains how technical analysis works in general. It is based on the following idea: let’s say, that you formatted a certain pattern on the graph, which resulted in the price moving in a particular way. The next time the same pattern occurs, it is likely the price will behave similarly. At the very least, its probability will be much higher than the probability of a different scenario.
People change the market and their actions can be explained by psychology. Technical analysis allows market trends to be seen in graphic form.
The main problem is that the probability of an absolutely identical situation occurring is extremely rare. That is why analyzing the patterns is a priority. Often, a trader has to decide whether the situation on the graph fits the pattern or not, and question whether he should open a deal.
Why to trade with Libertex?
- access to a demo account free of charge
- technical assistance to the operator 5 days a week, 24 hours a day
- leverage up to 1:500
- operate on a platform for any device: Libertex and Metatrader 4 and 5
- no commissions for extractions in Latin America


