Stochastic Oscillator: Find Your Reversal Point
Stochastic Oscillator is one of the most useful indicators among traders worldwide. It was developed at the end of the 1950s. However, it’s popularity hasn’t vanished, but increased even more. Why do traders like this indicator and how can you catch its signals? We have created a complete guide that will tell you everything you need to know about the Stochastic Oscillator.
What Is Stochastic?
The Stochastic Oscillator is one of the technical instruments traders implement to determine buy and sell signals, along with the trend direction. It measures the market momentum and shows possible trend reversals.
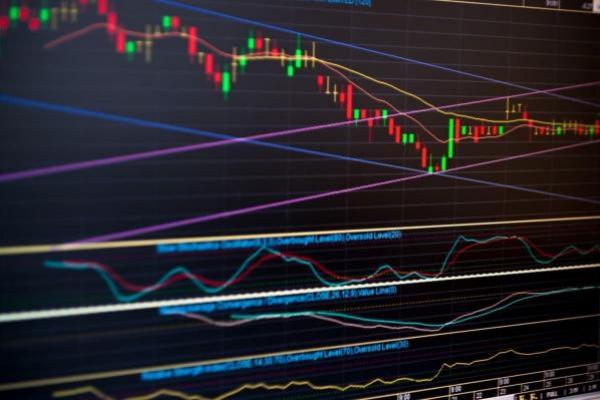
The Stochastic Oscillator consists of two lines - %K and %D. It’s placed in the window below the price chart.
The indicator consists of two lines. The fast line is called %K (blue); the slow one is %D (orange). The slow line is the Moving Average of the fast one. Stochastic, like most of the oscillators, is placed below the price chart. Look at the picture below.

How to Implement the Stochastic Indicator in MetaTrader 4
Fortunately, the oscillator is set by default in MetaTrader 4 and most trading platforms. Thus, you don’t have to download it. All you need to do is to click “Insert” – “Indicators.” There you will see groups of indicators, so you choose Oscillators. After this, you will find the Stochastic Oscillator.
The Stochastic Oscillator is set by default in MetaTrader 4 and most trading platforms. The standard settings are 5 for the fast line, 3 for the slow line, and 3 for slowing.

If you are familiar with the technical indicators, you know each of them has unique settings. A great feature of the index is that it can be applied to any timeframe. The standard settings are 5 for the fast line, 3 for the slow line, and 3 for slowing. The indicator compares close prices to prices of the specified period of the timeframe. Thus, the following setting is the price field. It should be low and high.

Still, you can use other settings that may be more suitable for your trading strategy. You can try 14 or 21 for %K, 3 or 5 for %D, and 3 or 5 for the slowing.
Types of Stochastic
There are three types of Stochastic Oscillators. They are fast, slow, and full. The type difference is based on the calculation.
There are three types of Stochastic indicators. These are fast, slow, and full.
Fast Stochastic
This type reflects the current price positions regarding the set of a number of previous bars. The fast Stochastic usually has the following settings: 5 for the %K line and 4 for the %D one. The Fast Stochastic has a quicker reaction to price changes.
As for the formula, the %K is calculated as follows:
[(Close Price – Low Price) / (High Price – Low Price)] x 100
The Fast %D line is similar to the standard formula. It’s a simple moving average of the %K line with the period of 3.
Slow Stochastic
There are not many differences to the fast stochastic. However, the slow %K is the same as the fast %D (thus, it’s a 3-period moving average of the fast %K). Simultaneously, the slow %D is also a moving average but of the slow %K. The standard settings for the slow stochastic are 14 of the %K and 3 of the %D line. The slow Stochastic limits the number of false signals.
Full Stochastic
The full Stochastic is like the slow Stochastic, but it includes an additional parameter. It allows an investor to determine the period of the simple moving average besides the standard period of 3. Settings of 14 and 3 are considered as standard for this type.
Read Signals
We are at the most exciting part of this tutorial. Now, you will learn how to read the signals of the indicator.
Stochastic is a range-bound tool, which moves in the area from 0 to 100. It means you can easily determine the points when the market is overbought and oversold. It will give you potential entry and exit signals along with the possible market trend.
There are two main points. These are 20 and 80. Thus, when the indicator is above 80, it’s a sign that the market is overbought. You can expect a downward movement. Readings below 20 signal oversold conditions. This means the market may turn up soon.
20 and 80 are the crucial points that determine when the market is oversold and overbought.

However, that’s not all. Being in these areas, the indicator doesn’t guarantee a 100% reversal. If the market trend is robust, there are risks the price won’t reverse. That’s why it’s worth looking at the indicator’s lines as they were created for a reason.
As we mentioned above, there are two lines: %K and %D. The interaction of them will be crucial for forex signals. You get a sign of an upward movement when %K crosses %D bottom-up and a signal of a downward move when %K breaks %D upside-down. However, the signs will be more precise if the cross is in the overbought area for a sell signal, and in the oversold territory for a buy signal.
Previously, we warned you that there could be a stable trend that will cause fake signals. But we will teach you how to avoid them.
Opening a position on one timeframe, check the current trend on a bigger one.
For example, if you trade on , check the trend on the daily one. If there is a strong trend, don’t open a position against it even if the indicator is in extreme areas. It can stay there for an extended period, and you will just suffer losses. It’s better to trade in the trend. Thus, focus on the signals positively correlated with the current market conditions. For instance, in the case of the uptrend, wait until the indicator forms a buy signal. If you trade in the downtrend, wait for a sell signal.
If this sounds complicated, we created a video for you that will explain Stochastic signals in just a few words. Watch the video and keep it as a tip that you can find fast.
Why trade with Libertex?
- Get access to a demo account free of charge
- Receive live technical assistance 5 days a week, 24 hours a day
- Enjoy leverage of up to 1:500
- Use a platform for any device: Libertex and MetaTrader 4 and 5
- Pay zero commission on withdrawals in Latin America
- Benefit from up to $500 protection on your first trades with Negative Trade Protection