
Ichimoku Kinko Hyo: Difficult Yet Effective
A newbie trader might be intimidated even by only the name of this indicator. If they look at it on the chart, it’s unlikely the opinion will change. Ichimoku Kinko Hyo sounds and looks complicated. That’s why many traders try to avoid using it. Nevertheless, it’s one of the most common and useful indicators for Forex traders. We will do our best to explain it as simply as possible.
Ichimoku Kinko Hyo: What Does It Mean?
Ichimoku Kinko Hyo, or Ichimoku, is a technical analysis indicator that consists of five lines, which are the tenkan-sen, kijun-sen, senkou span A, senkou span B, and chikou span. It was created by a Japanese journalist, Goichi Hosoda, in the late 1960s.
This indicator is used to gauge momentum, determine the trend, and place support and resistance levels. This wide range of applications makes it a match for most of your trading needs.
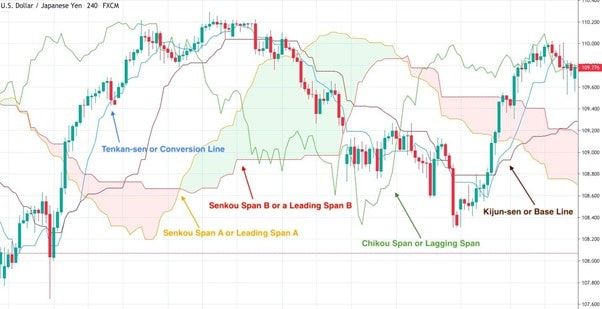
How to Interpret and Calculate the Ichimoku Kinko Hyo
As we said above, the indicator consists of five lines. Let’s take a closer look at them:
- Tenkan-sen (blue line) is a conversion line. To calculate it, you need to add the highest high and the highest low, over the past nine periods, and then divide the result by two. This line is commonly used to determine support and resistance levels and a trend reversal.
- Kijun-sen (brown line) is a base line. If you want to calculate it, you need to add the highest high and the lowest low over the past 26 periods and divide it by two. This line has similar functions to the Tenkan-sen; at the same time, it can be implemented as a trailing stop-loss point.
- Senkou Span A or leading span A (orange line). You need to add the tenkan-sen and the kijun-sen, and divide the result by two. Then you will plot the result 26 periods ahead. This line is one of the edges of the cloud, and it’s used to determine future support and resistance levels.
- Senkou Span B or a leading span B (red line). You can calculate this line if you add the highest high and the lowest low, over the past 52 periods, divide the result by two and plot it 26 periods ahead. This line works together with the Senkou Span A and forms another edge of the cloud, which will determine future support and resistance areas.
- Chikou Span or lagging span (green line). This line stands for the current period's closing price plotted by 26 periods back. The function is similar to previous ones – to find possible support and resistance levels.
This brief explanation should make it easier. Take a look at the picture below to find all the mentioned lines on the real-life chart.
Conclusion
To conclude, the Ichimoku Kinko Hyo indicator sounds and looks complicated. Many traders don’t use it because of that. However, it’s a big mistake. All you need to do is find proper colors for each line and learn what signals the lines provide. In the beginning, you can simply save the part of our article where we talk about lines’ functions and use this part while trading. To put your knowledge into practice, use a Libertex demo account. It’s a free and easy way to build your new trading strategy with the new indicator.
Why trade with Libertex?
- Get access to a demo account free of charge
- Receive live technical assistance 5 days a week, 24 hours a day
- Enjoy leverage of up to 1:500
- Use a platform for any device: Libertex and MetaTrader 4 and 5
- Pay zero commission on withdrawals in Latin America
- Benefit from up to $500 protection on your first trades with Negative Trade Protection