Global financial market participants are looking forward to resolving the political tensions in Hong Kong. The situation between protesters and the government has recently escalated to the limit. The tension of the situation can only be compared to a game between long-time rival football teams.
What is happening in Hong Kong?
Events in Hong Kong are developing rapidly, although political protests began a long time ago. They interfere with the work of the entire country’s infrastructure and also have a negative impact on the performance of the entire economy in the region.
The United States is adding fuel to the fire - the US Senate passed a bill on the protection of human rights and democracy in Hong Kong. It also voted for a bill that bans the supply of certain types of ammunition to Hong Kong police from the United States.
Washington’s actions have led to the deterioration of bad relations between the US and China. The parties have long had irreconcilable contradictions on trade, and the story with Hong Kong adds more problems to their negotiations. China considered the US actions as interference in its internal affairs and now strongly doubts that it should make concessions to the American side in matters of trade. Nevertheless, Libertex traders were able to earn on negative news. One of the experienced Libertex traders used his $27,000 to make a $120,000 profit in November on GBP/USD and EUR/USD.

Why do Libertex traders win?
To successfully trade in the market, a trader needs to have tools for conducting technical analysis. The correct analysis allows you to determine the entry and exit points of the transaction, the levels of stop loss and take profit, and most importantly, the direction of the transaction.
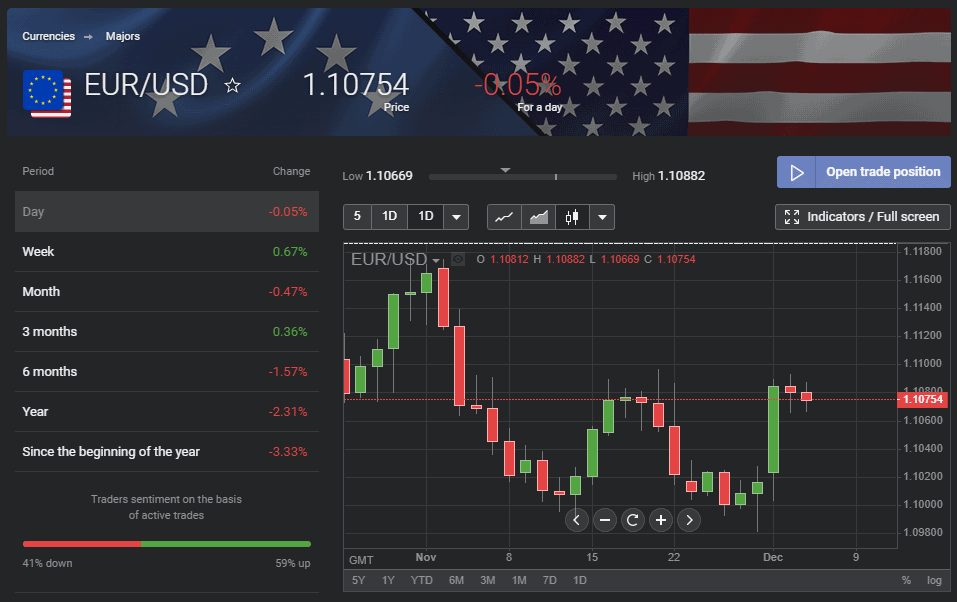
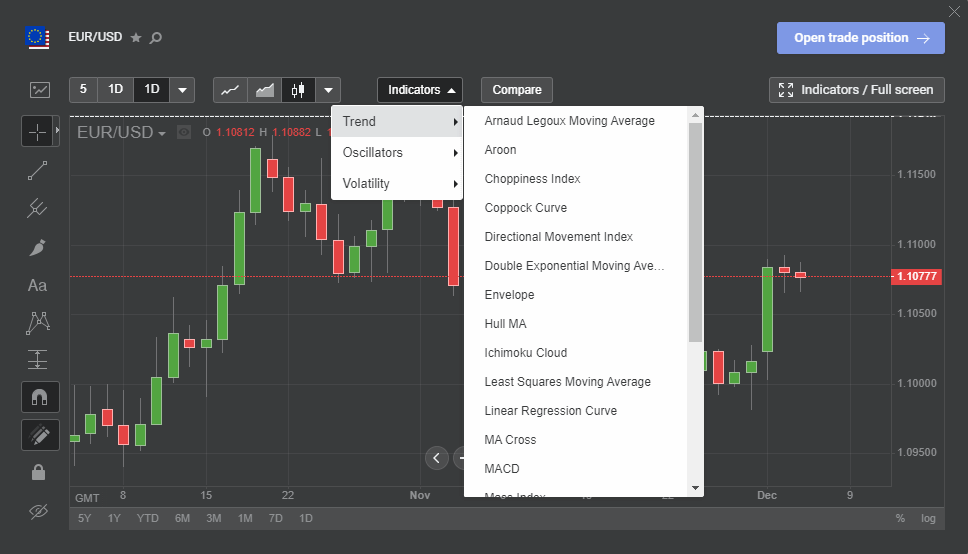
The Libertex trading platform has the tools that allow you to conduct the most complete market analysis. To start using these tools, open an account in the Libertex trading platform. Now, all you have to do is select the tool you want to analyze and click the “Indicators/Fullscreen” button or the “Technical analysis” button in the chart window of this tool. In both cases, you will be taken to a window where the technical analysis tools that are available to you will be visible on the left.

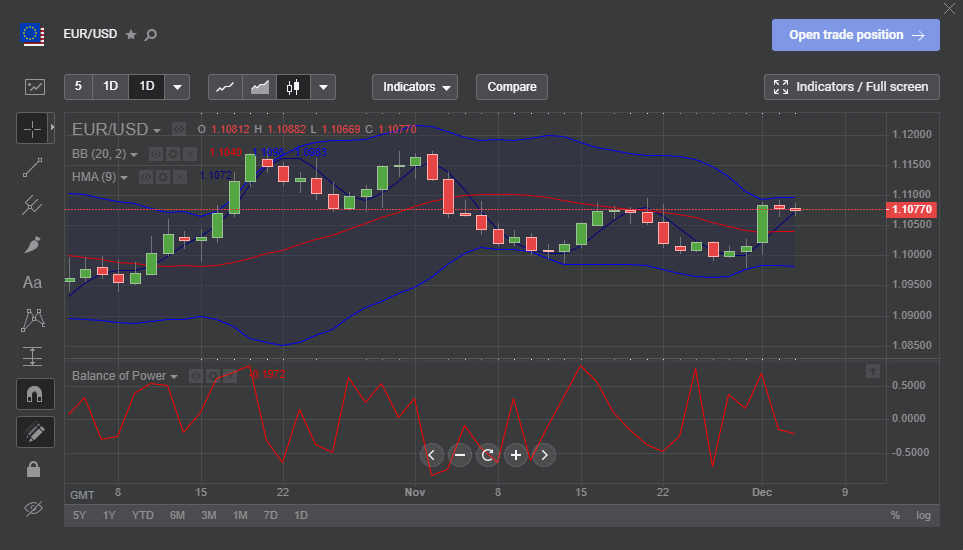
By clicking on the corresponding icon you can place on the chart such tools as Trendline, Pitchfork, as well as various technical analysis figures from the XABCD-pattern section (such as for example Elliot Waves or the Head and Shoulders figure). In addition, by clicking the Indicators button above the chart, you can use trend indicators, oscillators, and volatility indicators. To do this, just select the tool you need, for example, Moving Average Weighted, which shows the trend, and it immediately appears on the chart.

You can add several technical tools to the chart of the selected tool. This will allow you to conduct the most complete analysis of this asset and make the right decision about the transaction. All that remains for you to do next is to enter the amount of the transaction, select the multiplier, and open the transaction.
Do you want to trade in the financial market and not pay attention to negative news? Open an account in the Libertex trading platform!


