What Are Gaps?
A gap is a space on a chart where a security's rate both increases or decreases from the preceding day's ending with no trading activity happening between these time intervals. As a consequence, the asset's chart reveals a gap in the standard price pattern. The ambitious trader can understand and use these gaps for profit.
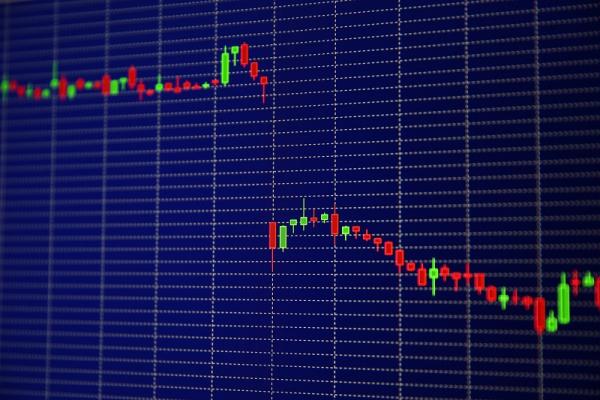
Generally, candlesticks on a Forex chart open at the same level where the last candle was closed after the end of the trading session. After that, a new candle is opened immediately.
That is what happens in typical situations. Despite that, when a gap performs on the chart, you see a possible divergence between the starting and the ending price of the two connecting candles.
A gap is a space of a chart where a security's rate changes with no trading activity happening in between.
What Is Gapping

Gapping is when a stock, or different trading tool, opens over or under the preceding day’s end, with no trading action in between.
For example, the share price picked at the level of $338.00 on Wednesday and opened at $356.40 on Thursday, and no trading happens in between this space. This unfilled interval looks like a gap on the chart.
What Causes Gaps in The Market?
Gapping in the market happens due to many factors. Here are the most common of them:
Political Events

Some of these events are essential. For example, the US dollar has decreased slightly after trading steady among other global currencies, presenting a small gap, after revealing the news about Trump’s impeachment. On 19 December 2019, the US dollar index DXY was trading at the level of 97.33.
Economical Events
Significant economic moves can change not only a single position on the Forex market. Some of them can affect the global economic landscape, such as Black Wednesday. In 1992, between September and December, the GBP/USD declined by about 25%, down to the level of 1.5057. Furthermore, there was no trading activity in that period.
Natural Disasters
The result of a natural disaster may cause a catastrophe for a country. Earthquakes, floods, and hurricanes hurt country's residents, confidence, and infrastructure. Besides, such disasters will also harm a nation's official currency.
For example, Harvey Hurricane had led to instability at the absolute worst time for the markets. A previously weak dollar dropped to a one-and-half-year low against a currency basket.
The USD index was falling at 92.501 value by 28th August 2017 and had earlier dropped to 92.372. It was the lowest position since early May 2016.
In brief, gaps are mostly built by significant changes, making it all the more valuable for traders to remain refreshed by the economic program, as well as other geopolitical matters.
Gap Types

There are four types of gaps, excluding the gap that happens because of a stock reinvestment. Each type has its unique implications, so it is crucial to be able to select between them.
Common Gaps

They can develop from a stock reinvestment when the trading volume is low. These gaps are common and typically get filled almost immediately. "Getting filled" means that the price action, in the last few days or weeks, usually returns at the least value to the previous day before the gap. It is also known as closing the gap.
A common gap appears typically in a range-bound or congestion zone, where it strengthens the apparent absence of interest in the stock at that time. It is frequently increased more by a low trading volume.
Being conscious of these types of gaps is useful, but it's questionable that they will provide trading opportunities.
Breakaway Gaps

It’s a new trend where the asset ‘gaps away’ from the price pattern. If a breakaway gap is followed by higher trading volume, it may be deserved to get a position long for a breakaway gap up, and short for a breakaway gap down, on the candlestick next to the gap.
Runaway Gaps

Runaway gaps may be termed as gaps caused by a raised interest in the stock. Runaway gaps usually describe traders who did not get in through the first move of the uptrend and, while waiting for a temporary reversal in price, decided that it wouldn’t happen.
Elevated buying interest appears suddenly, and the price gaps over the past day's ending. This kind of runaway gap describes a state of traders’ panic. Also, a good uptrend can have runaway gaps caused by significant news and events that produce new interest in the stock.
Why trade with Libertex?
- Get access to a demo account free of charge
- Receive live technical assistance 5 days a week, 24 hours a day
- Enjoy leverage of up to 1:500
- Use a platform for any device: Libertex and MetaTrader 4 and 5
- Pay zero commission on withdrawals in Latin America
- Benefit from up to $500 protection on your first trades with Negative Trade Protection