Draw Effective Support and Resistance
Support and resistance are leading concepts for traders. They are used in many strategies and help investors enter and exit the market. Also, they are widely used for placing take profit and stop loss orders.
Support and resistance levels are an effective tool for any market, including and stock. It’s not complicated to draw these lines. However, it’s crucial to know where to draw them.
Support and Resistance: A Piece of Theory
In general, support and resistance are levels where the price is supposed to meet an obstacle and turn around.
Support and resistance are levels where the price will either reverse or slow down.
Resistance is the upper level to which the increasing price moves. Traders expect the rate to either rebound from this level and move down or simply slow down its surge. If the price manages to break above the resistance, it will confirm the strength of the uptrend. However, the price will keep looking for the next obstacle to rebound.
Support is the lower level to which the declining price moves. Same as at the resistance, the price is anticipated to either reverse and go upside or slow down its fall. If it’s able to go through this level, it will confirm the downtrend's strength, and the price will continue to look for the next obstacle.
S&R Types
There are many types of support and resistance levels. Let’s consider the crucial ones.
Swing Highs and Lows
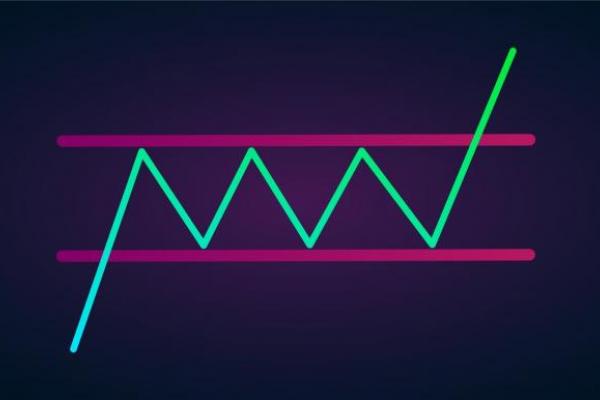
It’s a traditional type of support and resistance level. To determine any of them, you just need to pick up the closest point where the price turned around. If you draw a horizontal line through this level, you will get possible support or resistance.
So, if you see a swing low where the price turned up, it will be a support. If you find a swing high, where the price reversed downward, it will be resistance. This type of support and resistance is the most reliable.

Stepping Swing Points
This type occurs in trends. If you see a strong trend, you can expect the price to break support/resistance levels. As soon as the price breaks the obstacle, this level changes its first destination.
For example, imagine you trade in the downtrend. The price broke below the first support. As a result, this support became a resistance for the price. You can expect the asset to return to this level, and the pullback to occur. Thus, you can either enter a long position targeting the newly formed resistance or trade on a downside reversal from it.

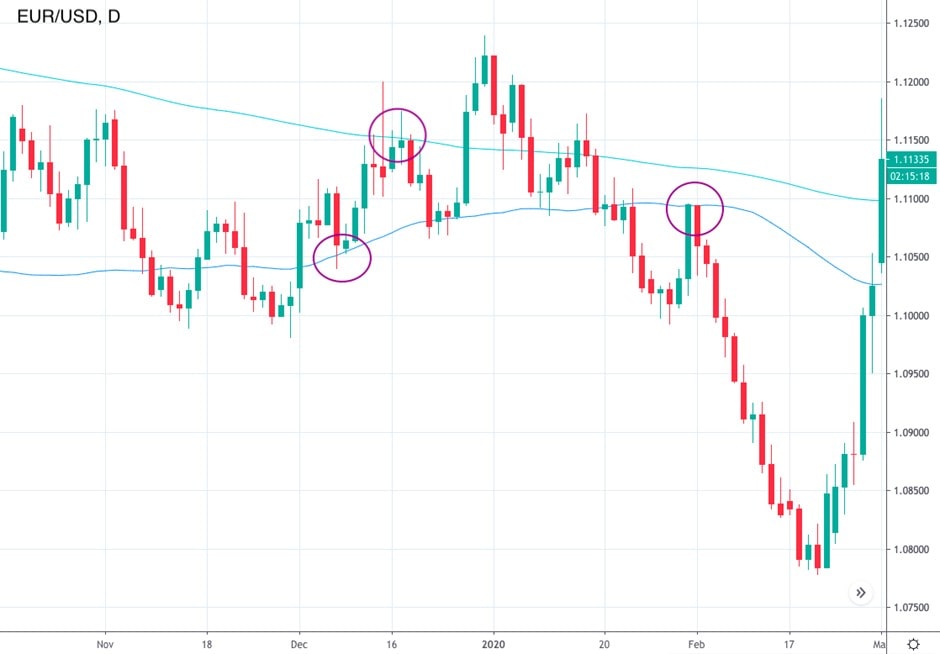
Dynamic Support and Resistance
These levels change regarding the timeframe. They are not drawn. To get them, you need to implement . One of the moving average line functions is to serve as a support or resistance level, depending on its location to the price. As the indicator always moves, support/resistance changes all time.
Conclusion
In conclusion, support and resistance are important levels every trader should know about. They help determine entry and exit points. Also, they show the current market picture and can predict the future price direction.
Yet, it’s essential to know how to draw them. For this, you need to practice a lot. A Libertex demo account allows you to develop your skills. It includes the full range of securities and instruments that resemble the real account. The main advantage is that you can train without any risk of losing money.
Why trade with Libertex?
- Get access to a demo account free of charge
- Receive live technical assistance 5 days a week, 24 hours a day
- Enjoy leverage of up to 1:500
- Use a platform for any device: Libertex and MetaTrader 4 and 5
- Pay zero commission on withdrawals in Latin America
- Benefit from up to $500 protection on your first trades with Negative Trade Protection