
The Alligator Indicator by Bill Williams: Use Your Imagination
The Alligator indicator is one of the basic trend indicators. The idea of the indicator is simple – determine the trend. Bill Williams believed that market players collect most of their profits during strong trends. When Mr. Williams was working on the indicator, he followed the presupposition that the financial markets move within the trend just 15% to 30% of the time, while markets are in sideways ranges the other 70% to 85% of the time.
What Williams Alligator Stands For
The Alligator indicator is a trend indicator that consists of three lines – smoothed moving averages. Bill Williams called these moving averages balance lines. Each of them depicts a part of the alligator’s mouth:
- Alligator’s Jaw (blue line) – the slowest moving average. It is a 13-period moving average, which is moved 8 bars forward.
- Alligator's Teeth (red line) – the intermediate 8-period moving average, which is moved 5 bars into the future.
- Alligator's Lips (green line) – the fastest moving average among three. It’s the 5-period moving average, which is shifted 3 bars ahead.
Why the Alligator Indicator Matters
Alligator is not the only indicator created by Bill Williams. Nonetheless, it’s famous among Forex traders all around the world. The popularity is based on simplicity and accessibility. You can easily find the indicator on any trading platform.
Also, you don’t need to change any settings. If you are familiar with other indicators, you know that most of them require changing the settings regarding the timeframe you trade. It’s not the case with the Alligator indicator. Moreover, it’s easy to remember the signals the indicator provides. Just associate the indicator with an actual alligator and imagine its life stages.
How the Alligator Pattern Works
Let’s see how the indicator works and what signals it gives.
Basic Calculations
Even though you don’t need to calculate the indicator yourself, it’s worth knowing what the rules of the lines’ building are. As we said above, the indicator has three smoothed moving averages of 5-, 8-, and 13-periods.
The formula is simple:
- Median price = (HIGH + LOW) / 2
- Alligator’s jaw = SMMA (Median price, 13, 8)
- Alligator’s teeth = SMMA (Median price, 8, 5)
- Alligator’s lips = SMMA (Median price, 5, 3)
Where:
- HIGH – the highest price of the bar
- LOW – the lowest price of the bar
- SMMA (1, 2, 3) – smoothed moving average. A is the median price, B is the period of the moving average, C is the move to the future.
Let’s Read the Alligator Indicator Signals
The Alligator is always implemented into any trading platform because of its simplicity. It’s one of a few indicators that even a newbie can use.
The name of the indicator is not random. Bill William created the analogy with the alligator to describe the behavior of the market, according to the phases of the alligator’s daily routine. For example, the time of the trend absence or sideways moves relates to the alligator’s sleeping. After, the alligator wakes up and looks for its prey – it’s a period of the trend. The trend strength depends on the length of the sideways trading as the alligator’s hunger depends on when it was sleeping.
Traders use this indicator to determine the lack of a trend, a period of the trend formation, and its direction.
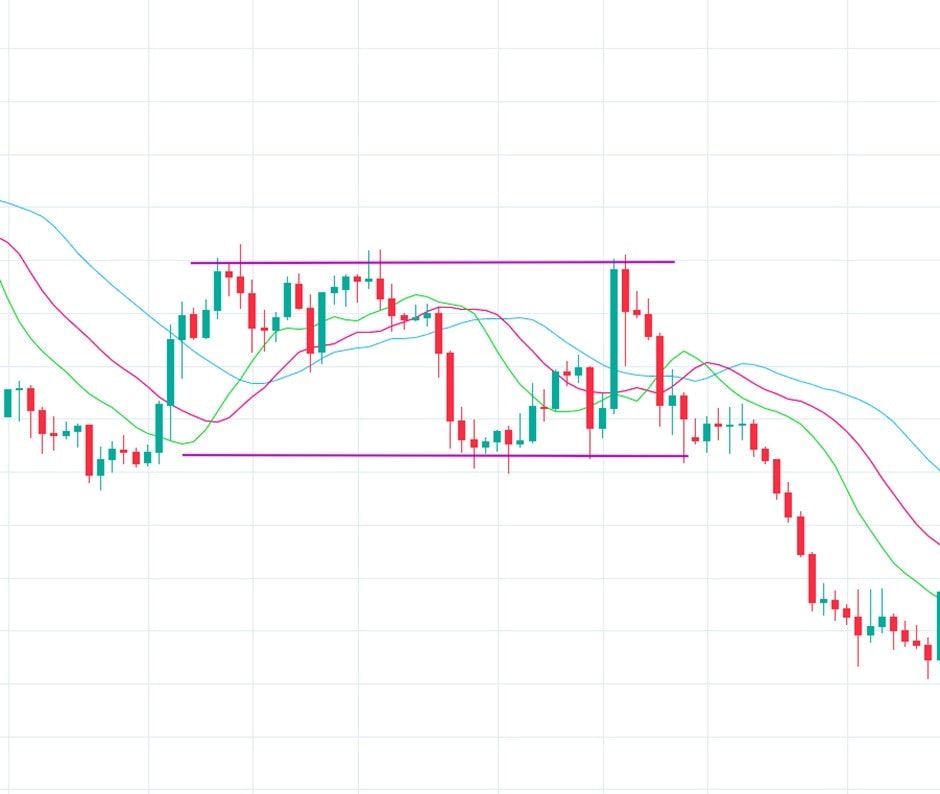
Lack of the Trend
It’s the time when our alligator is sleeping, so its jaw, teeth, and lips are serried. As a result, all Bill Williams 3 lines are either too close to each other or intertwined. Look at the chart below. As you can see, the pair had been trading sideways, and the indicator’s lines were crossing each other. Mr. Williams recommended staying out of the market in times of consolidation.
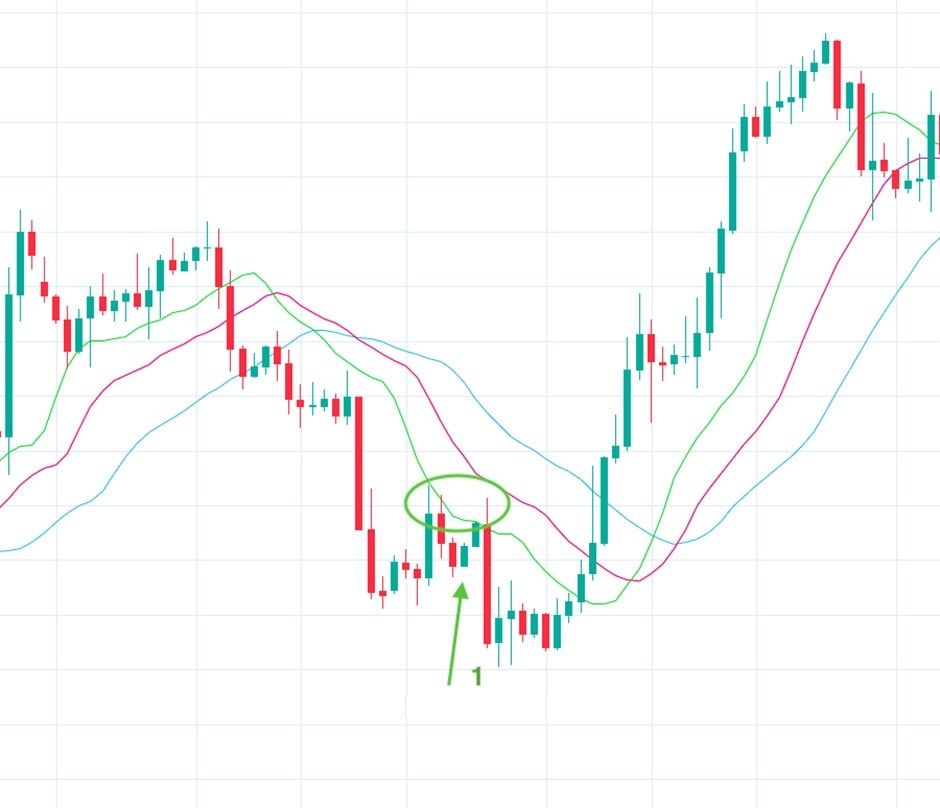
Trend Formation
We can notice the formation of a trend when the fastest moving average (green line) crosses the other two lines. All of the lines should move in one direction. The strength of the trend will reflect the length of the sideways movement. The bigger the distance between the lines, the stronger the trend is.

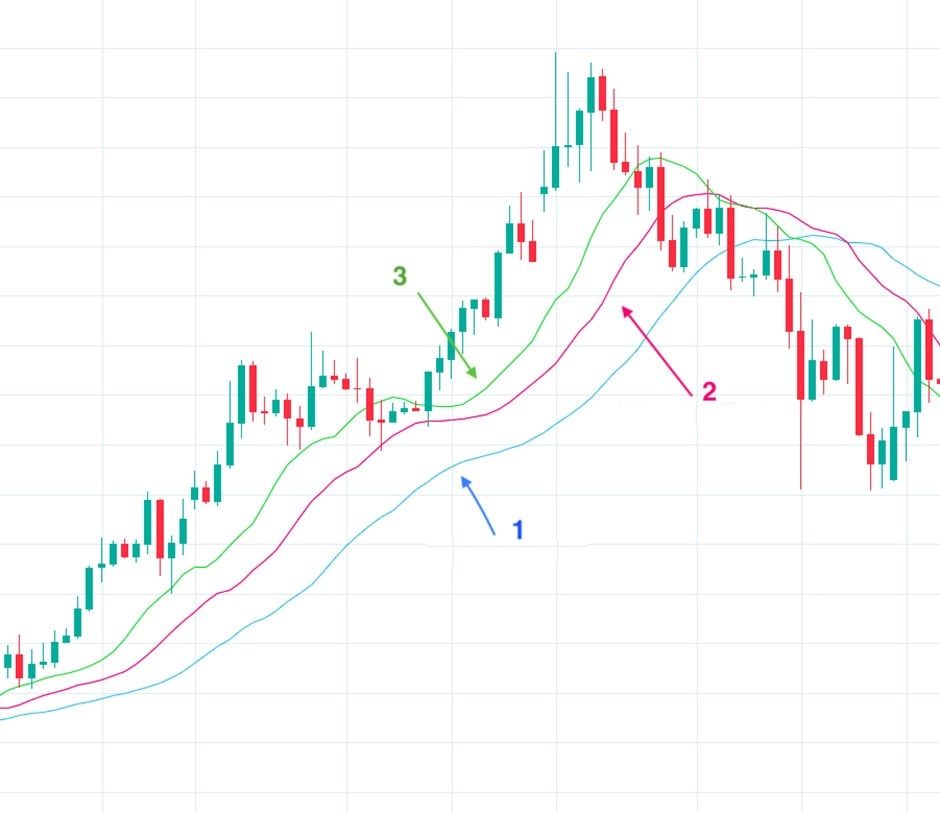
Trend Direction
The course of the moving averages simply identifies the direction of the trend. If they move down and widen even more, it’s a strong signal of the downtrend. If they move up and diverge from each other, it’s a sign of the strong uptrend. Note that all three lines are under the price in the uptrend, and above the price during the downtrend.
Nevertheless, it’s more important for a trader to determine the direction in the initial stages. You can learn the trend direction following the fastest (green) moving average. If it crosses other lines from top to bottom, it’s a signal to sell. When it breaks above both moving averages, it’s a signal to sell.
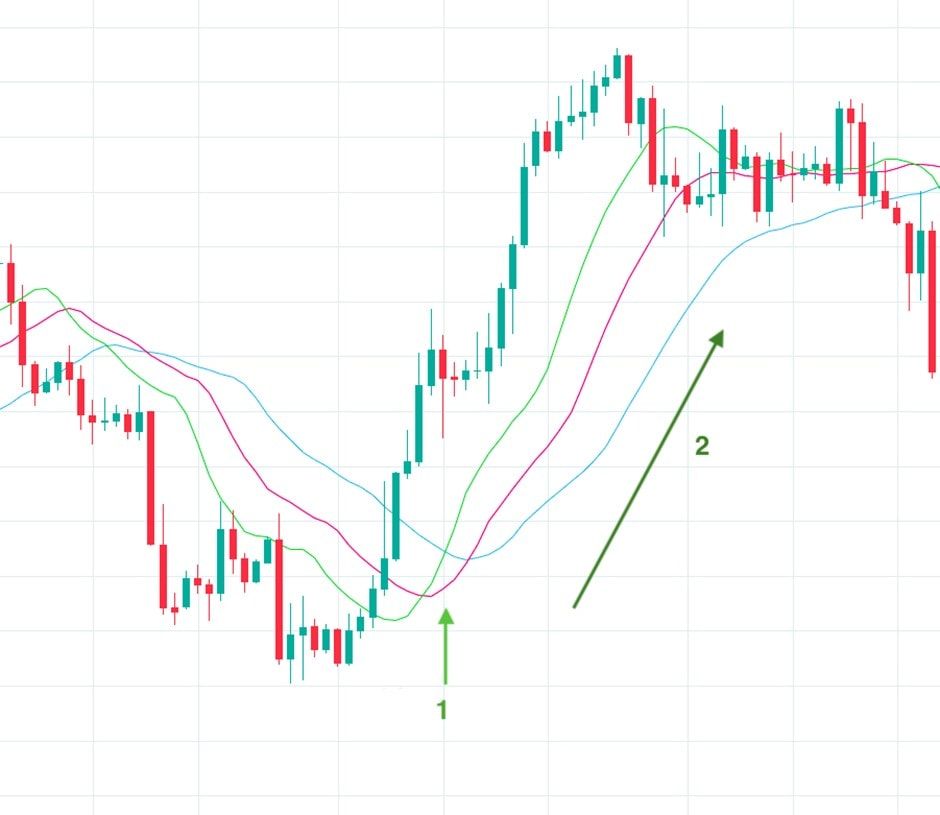
2. Strong uptrend.
Trend Strength
You can detect the power of the indicator not only by the spread between the moving averages but the price interaction. If the price goes beyond the green line for short periods, it’s a signal that the trend will soon end. The more times the price breaks the green line, the weaker the trend becomes.
Why trade with Libertex?
- Get access to a demo account free of charge
- Receive live technical assistance 5 days a week, 24 hours a day
- Enjoy leverage of up to 1:500
- Use a platform for any device: Libertex and MetaTrader 4 and 5
- Pay zero commission on withdrawals in Latin America
- Benefit from up to $500 protection on your first trades with Negative Trade Protection